Google is making headlines in the digital news, among other things, with the launch of its Google Analytics 360 suite of tools, including its new Data Studio 360 dashboarding tool .
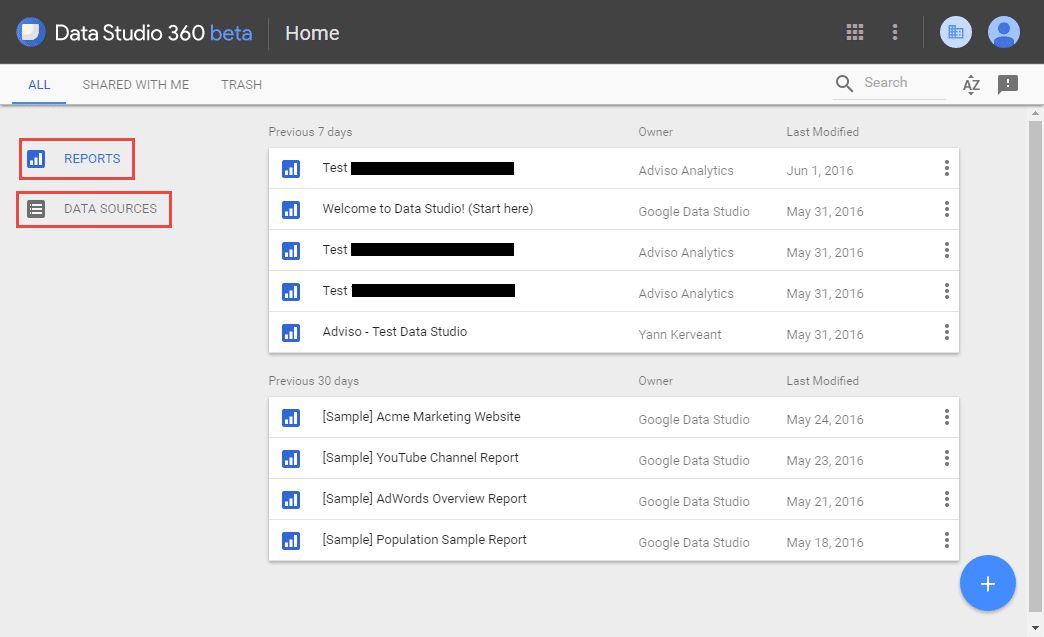
The only free tool among the now mostly paying suite of Google products, Data Studio is resolutely interactive and collaborative , both in terms of design and data consultation. Its free version limits each account to 5 reports, compared to 1,000 in its paid version. Currently available in Beta version only in the United States, it should be available soon in Canada.
As with the Google Analytics interface, the interface is very intuitive. The tool is divided into two main parts: selection of data and construction of dashboards.
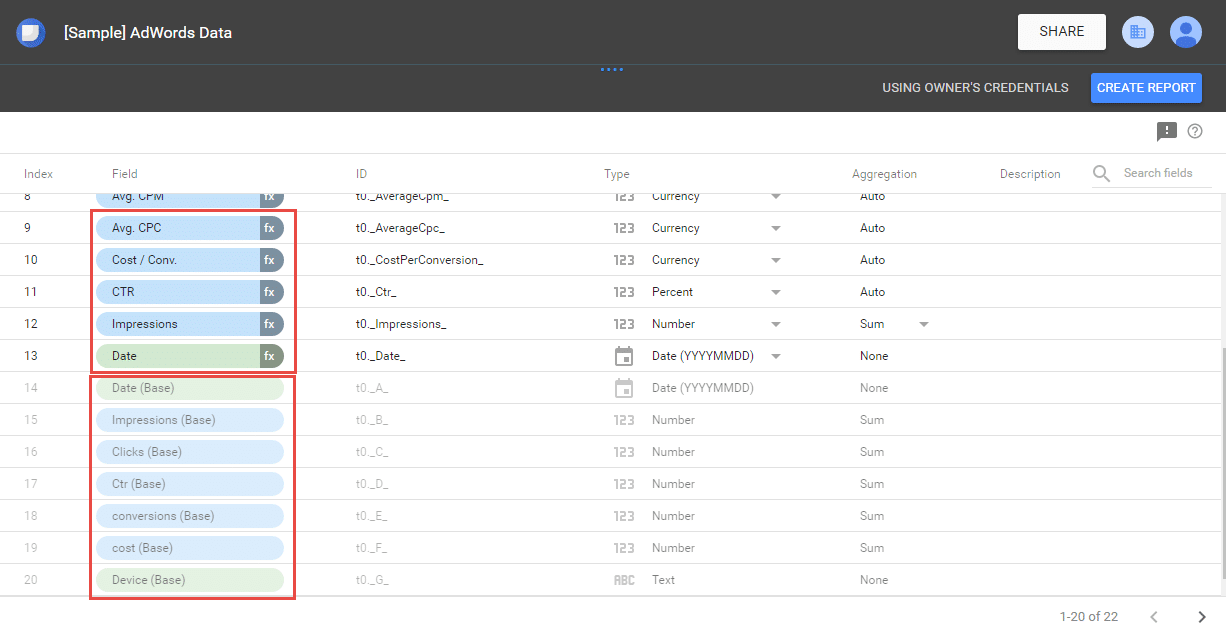
Data selection is probably the most technical and least intuitive part of the tool, in the sense that a good knowledge of the data structure is necessary in order to use the tool to its fullest. Among the significant advances offered, we note among others the possibility of creating custom dimensions and metrics with formulas .
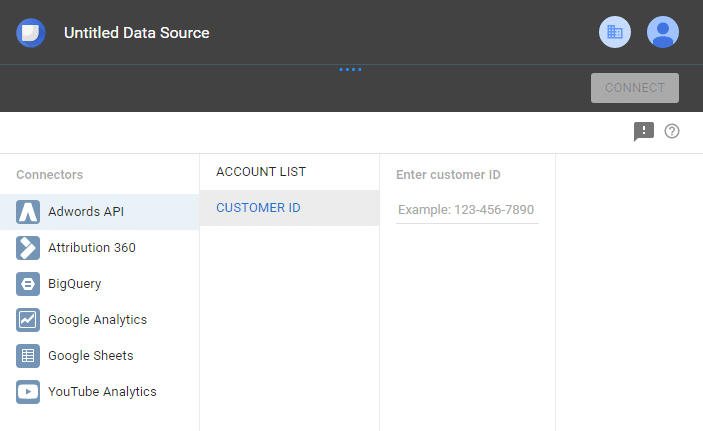
For now, only Google data sources (Adwords, Google Analytics, YouTube, Big Query, Attribution 360 and Google Sheets) are natively integrated, but the integration possibilities are immense. However, the current limitations can also be compensated by exporting to Google Sheet .
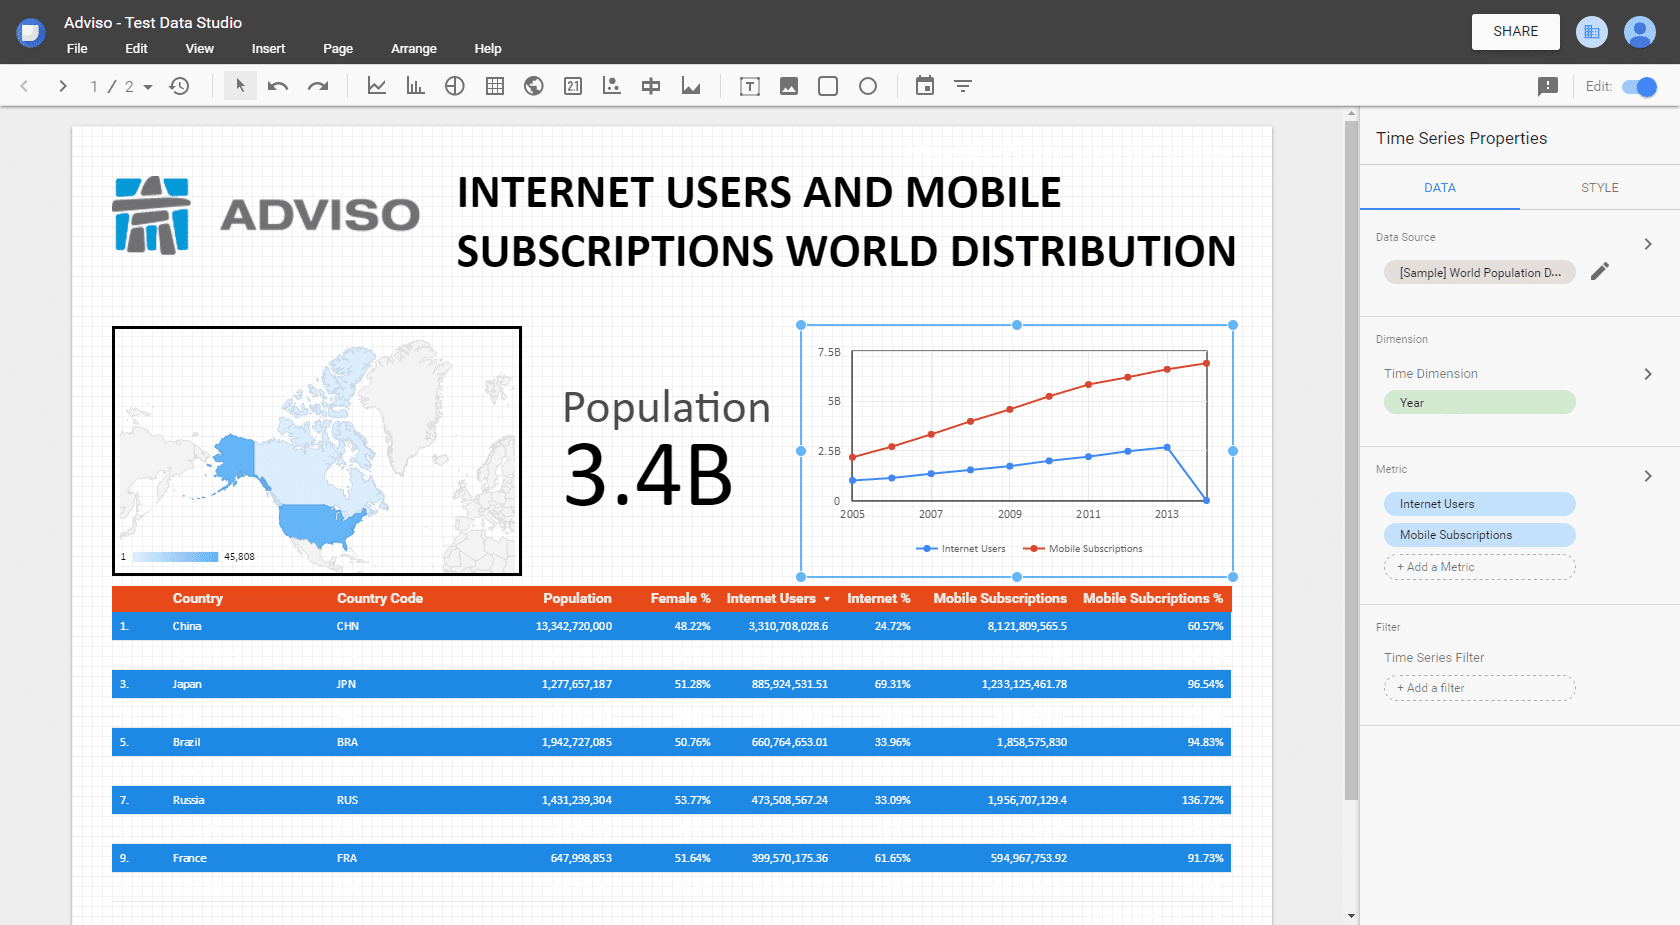
The creation of dashboards is intended to be very intuitive, Google having undoubtedly wanted to keep the playful aspect of its tools. The interface is divided into three sections: the center section allows you to preview the dashboards, the top section allows you to create the elements, while the side panel allows you to select and configure the data of each module, as well as to style them . A good example is one of the articles by Felipe Hoffa (developer advocate at Google), who in a few clicks links his databases and builds his dashboard . The collaborative aspect is also very developed, several users can collaborate in real time on the construction of the same dashboard and leave comments like the Google office suite.
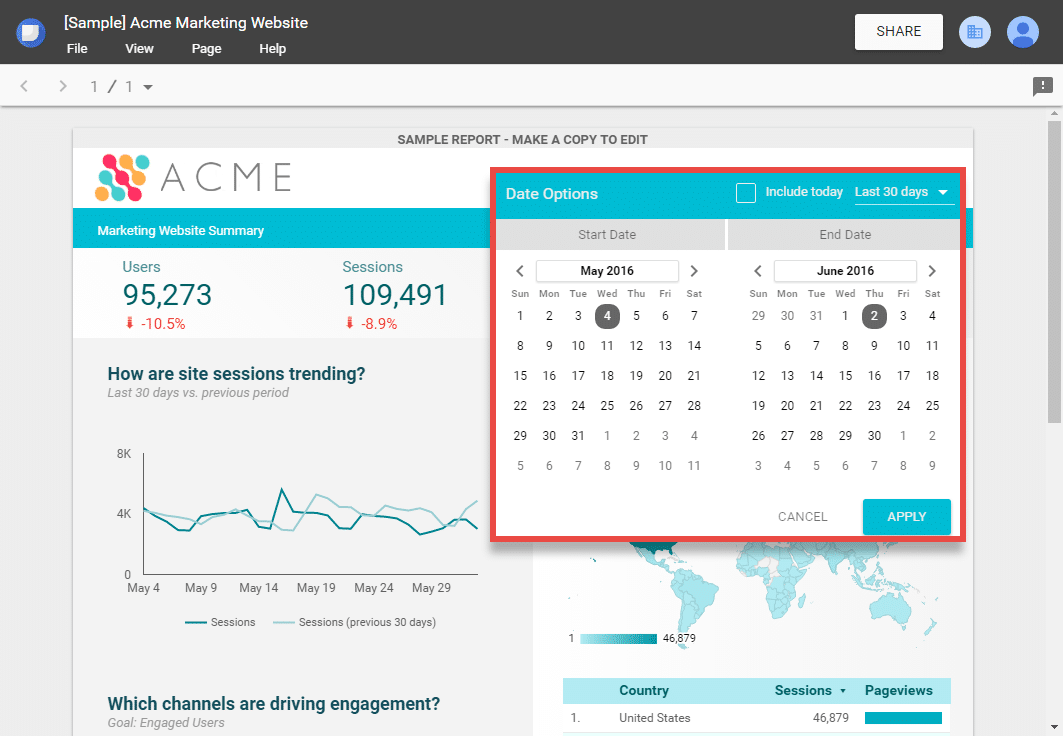
Finally, the consultation of the data leaves a lot of room for the actions of the users, who can choose the dates of analysis or sort the columns as they wish. It should also be noted that static exports (for example in pdf format) are impossible, Google's desire being more to create template-type reports that can be updated ad infinitum rather than static reports, in order to further minimize the time of reporting to maximize the analysis and thus the overall added value of the reports .
This tool is very promising, as it adds even more flexibility to creating custom tables. Leaving a lot of room for our creativity, we will soon be able to focus even more on the why of dashboards than on the how . As mentioned by the evangelist Avinash Kaushik in his legendary 10-year-old article, an excellent analytical tool cannot fulfill its mission alone, it must be coupled with significant human capital . I also invite you to read Anne-Sophie Guillou's excellent article from last month which highlighted the importance of defining objectives, strategies and tactics in web projects., a foundation too often overlooked in the data analysis process.


%20(1).jpg)