


In the first part of this two-article series, we demonstrated the importance of using an ad server for large-scale campaigns. We continue here by concretely studying this practice in one of our media campaigns.
The goal of our campaign was to maximize product uptake. All of our media led to a landing page on a microsite, but product sign-up could also be done from the client's main site. Due to the limitations of the website we were working with, we only had a “soft” conversion which consisted of opening a form. This campaign exploded conversions on the client's main site. So we ran several correlation analyzes to find the cause of the increase in conversions. The sum of our campaign impressions was identified as the primary influencer. Here is the data comparison:
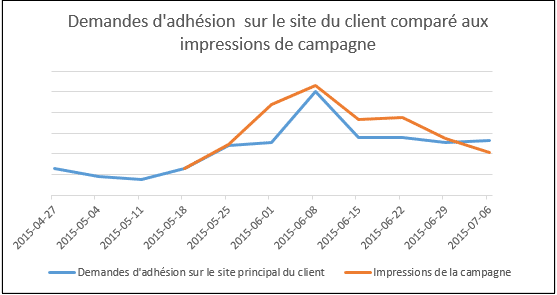
Analyzing the graph, we first note a sharp increase in requests to the site despite no media advertising sending traffic to the website. Then, we see that the variation in conversions is strongly correlated to impressions: the more we increase campaign impressions, the more we increase conversions on the website. These are therefore users (who may or may not have clicked on our ads) who went directly to the client's website to sign up for the product. The correlation coefficient was 0.82 with impressions versus 0.65 for clicks. It is therefore clearly demonstrated that the ads seen by users have an impact on their behavior. An analysis based solely on a campaign's “post-click” conversions omits the influence that an ad seen but not clicked can have. So that's why we went further!
The next step was to link the client's business objectives to our campaign results. Two things need to be considered:
- Not everyone who joined (submitted a complete application) qualified for the product.
- There were no major purchases of traditional advertising (radio, billboard, TV) for this campaign.
As we could only measure “soft” conversions, we compared different metrics to the actual results obtained by the client.
The first data analyzed allowed us to establish the correlation between all the requests received by the client and our campaign.
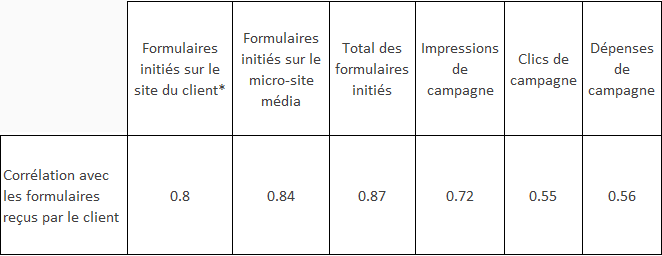
*: These are requests filled out on the corporate site, without going through a media click. The campaign drove clicks to the microsite.
The strongest correlation found was between the total number of forms started (on the client's site and on the micro-site) and the requests received. This correlation of 0.87 was extremely strong, but came as little surprise to us. Above all, we take away that the variation of forms initiated is consistent with that of forms sent. We can also conclude that impressions, clicks and campaign spend were not the main influencers.
However, the most interesting learnings were made by analyzing the accepted requests, because at the end of the day, what interests us are the actual sales of the client.
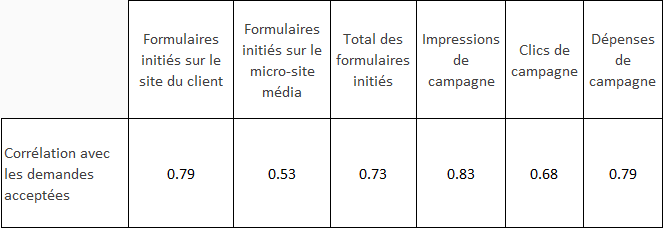
We first notice the weak correlation with requests on the micro-site. We deduce that a higher proportion of requests sent via the micro-site were not retained in comparison with those coming from the main site. Does this mean that the campaign attracted more unqualified users? We previously demonstrated that campaign impressions had an impact on requests from the customer site and that these increased during the campaign period. The answer is therefore no. Additionally, we see here that the biggest correlation has been with campaign impressions. Here is the visual representation of this correlation:
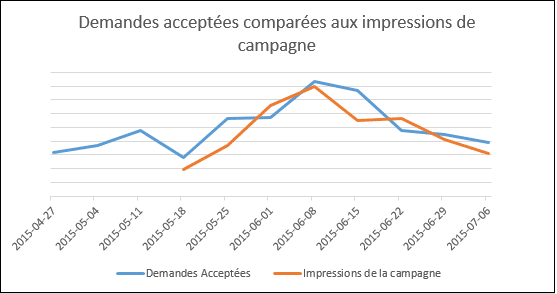
With this analysis, we were able to demonstrate the influence of our ads (clicked and unclicked) on the client's business results. By comparing the number of requests accepted each week during the campaign with those accepted in the six weeks preceding it, we were able to associate an accurate number of requests with the campaign. This number allows the client to calculate the return on investment of his campaign as well as an incremental cost per accepted request. In the case analyzed, the effect on requests continued for two weeks following the campaign. A very advantageous incremental effect for the client!
THE STEPS TO GO EVEN FURTHER
The systems currently in place do not allow us to accurately calculate the requests accepted by type of media placement. The analysis detailed above is therefore largely based on trend analyses. One of the difficulties in crossing this bridge is that we have to associate the data collected by our ad servers with our Analytics solution . These solutions are mainly interested in the source of origin of the users and do not care whether the user has seen an ad beforehand. This information is however essential for the optimization of a Display campaign.. In the meantime, we have started to insert a campaign conversion pixel on the form placed on the client's main site in order to optimize for an additional conversion point.
A buzzword that's being talked about these days is the "cross-device" attribution. Remember that we are targeting users on several devices (mobile, tablet, laptop, etc.). If we could accurately associate devices by user, that would be wonderful!
- We could better understand the influence of the medium and could demonstrate its impact even more. Currently, it is not possible for us to track between an advertisement seen on a mobile phone and a subsequent conversion on a computer.
- We could multiply the tactics. For example, advertising is often less expensive on smart phones, but conversion rates are also lower. If we could demonstrate with greater precision that a mobile ad influenced a user's behavior, it is likely that a greater portion of our budgets would target mobile.
In short, we can't wait for the technology to evolve to optimize even more efficiently!