Google has accustomed us to an annual Google Analytics update, usually around the time the trees begin to shed their leaves. The announcements generally coincide with the eMetrics where Google takes the opportunity to give a little kick in the kidneys of the competition. This time the tradition is broken and we are not talking about the addition of features such as advanced segments, custom variables or even custom reports but rather a new version of Google Analytics .
You understood correctly, it is not just an ergonomic or visual overhaul, but a new version which is intended as a basis for the evolution of the new generation of the product. Follow the guide, a lot of exciting new features on the program!
NEW UI
The interface has been completely redesigned, both in terms of navigation in the reports and in the presentation and use of the reports. A particular emphasis has been applied to the level of the user experience and the speed of loading.
The main menu separates dashboards, default reports and custom reports:
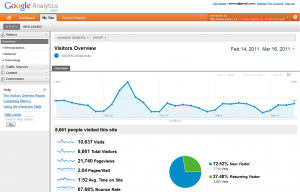
The very structure of the reports to which we have become accustomed has changed:
- the summary of the table is at the top of the page
- the different groups of reports (site usage, conversion, transactions) are also grouped at the top of the page with the summary
- all the options relating to the manipulation of the table are found in the header of the table (rather than having the filters at the bottom, the dimensions at the top)
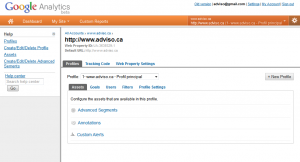
The management interface has also undergone a redesign – we introduce new concepts such as "Web Properties" and "Assets", concepts that we will be able to cover in a future post:
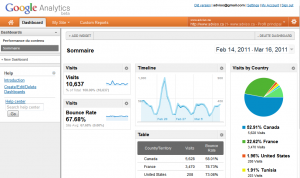
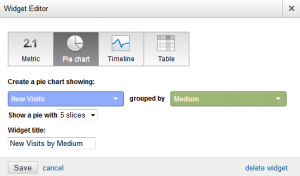
MULTIPLE DASHBOARDS
Several dashboards within a single profile, fact or fiction? Let's say partial reality! The lack of flexibility of the tables was for us one of the biggest sources of frustration: impossibility of creating several dashboards within a single profile, impossibility of renaming a block of content in a dashboard…
It's not perfect yet, but what we're being offered now is very promising! We can now create several dashboards and the blocks that compose them are now "widgets", which can be renamed and personalized:
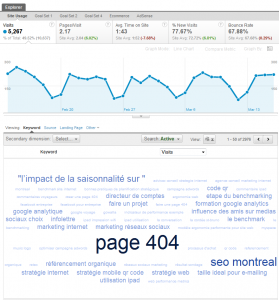
NEW VISUALIZATION: “TERM CLOUDS”
The good old tag cloud , nothing better for visualizing a large amount of data – our article on How to make a good 404 page is still popular:
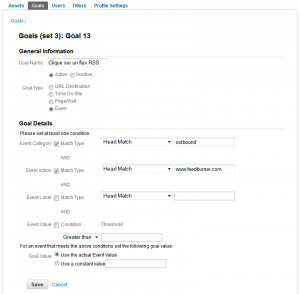
EVENT-BASED CONVERSION GOALS
Well hidden in the new goal management interface is a new option: event-based goals. A long-awaited feature! It's very useful to have all these events based on visitors' interactions with our site, but not being able to make them conversion objectives made life difficult for us. Not anymore:
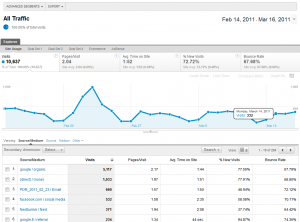
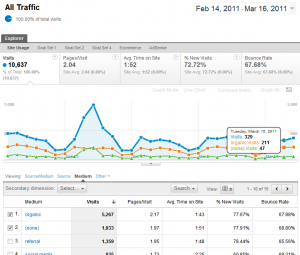
SHOW MULTIPLE DIMENSIONS IN A CHART
Formerly reserved for advanced segments, it is now possible to display multiple dimensions (think rows of a table) in a chart:
AND MORE
This is only an overview of the new version of Google Analytics. I repeat myself, this version is the basis of a new generation that only paves the way for new analysis options that allow us to evolve the practice of web analytics ninja!
The new version is currently offered to a restricted group of users but should be available to everyone in the coming weeks or even months.


%20(1).jpg)