What's the best way to structure your campaigns in Google Analytics to avoid sampling in your results? Find out in this article written by our analytics expert.
OVERTHROW THE PYRAMID
The pyramid structure is a great way to explain the concepts behind utm tagging a campaign, as I did in my article on how to structure your utm campaign hierarchy . Except that ONE detail undermines this hierarchy: sampling , or sampling, which is triggered when certain dimensions are used too much or badly.
Thus, if we want to respect the processing flow chart as much as possible (the process that assigns a source to a session), it is better not to represent the structure like this:
But rather like this:
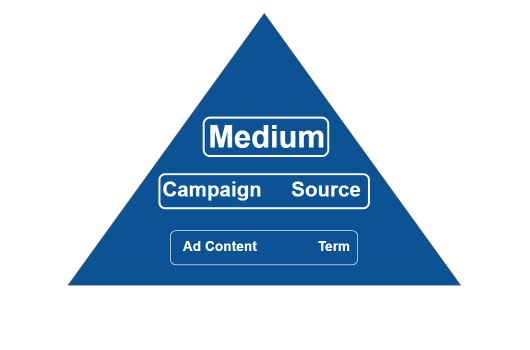
Google Analytics' intuitive campaign architecture works, and groups results in an aesthetically pleasing way , where each campaign has a row associated with it in reports. Unfortunately, this tagging strategy does not avoid sampling. This approach will be suitable for small campaigns at first, but will pose a problem when the time comes to analyze a lot of data, via annual analyzes for example. And let's not talk about major campaigns! The solution? Adopt a tagging strategy based on the variation of the utm Campaign parameter . This way of doing things avoids sampling , and therefore ruining your analysis.
QUICK REMINDER: SAMPLING AND PRE-ESTABLISHED REPORTS
Sampling only applies when a user's queries exceed 500,000 sessions on the property they are analyzing AND the analysis is not done on the pre-configured Google Analytics tables .
In the last step of processing your data, Google Analytics creates pre-established reports, also called standard reports. These reports have an enormous advantage, that of completely avoiding sampling . Like most reports produced by Google Analytics, reports by campaign are standard, even if a secondary dimension Source / Medium is added to the report. Another interesting detail, you can filter the data as much as you want both on the Campaign field and Source / Medium , no sampling will be applied to the report. Rather practical to analyze!
On the other hand, if the reports are crossed by adding a secondary dimension that is not part of the standard dimensions, these reports will no longer be standard. Take the same report per campaign but add the secondary dimension Ad content (ad content) which comes from the utm_content parameter : Patatra, mega sampling and potentially unusable report.
To illustrate, here is the same campaign report but associated with two different secondary dimensions: on the right with Source / Medium and on the left with Ad Content .
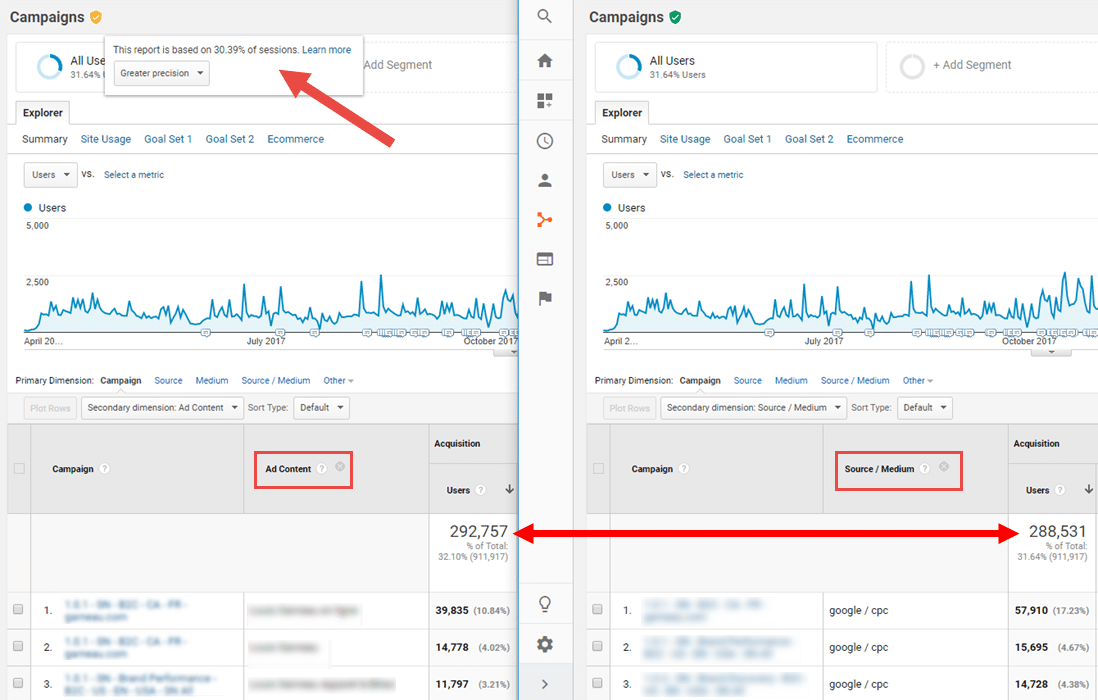
We can observe that the message next to the orange badge in the report with the Ad Content shows that the report is sampled from 30.39% of the sessions. The report with Source / Medium is not sampled, because the shield remained green.
We can also see that the sampling has the effect of altering the number of users: the real number is 288,531 in the report on the right, while this number is overestimated in the report on the left at 292,757. this difference does not seem major at first glance (4,226 users), the sampling is harmful on several levels:
- The sampling process is not constant: it may vary if you generate your analysis this morning, tonight or tomorrow. Thus, the analysis is not reliable because the same query varies over time.
- The difference can be quite small on the totals, on the other hand it can be much larger on the smaller sets such as small campaigns or sub-campaigns.
- The different indicators do not vary to the same extent: sampling lowers your sessions by 15% but your income by 30%.
If you are lucky enough to have access to a Google Analytics Premium account, then you can download an unsampled report. But if you are among the vast majority of Google Analytics users, you have no choice but to reduce or break up your date ranges to lower the sampling rate to a reasonable percentage. So, the result is a loss of time, more manual manipulations, not to mention non-additionable metrics, such as users for example, which complicate the analysis.
HOW TO AVOID SAMPLING?
The answer is by using the full potential of the three mandatory parameters that each session has in Google Analytics. I emphasize all sessions here, because even sessions that are not part of a campaign have a utm_campaign parameter : the value is then assigned to ( not set ).
Let’s review these three parameters:
1 – utm_medium : it is not recommended to customize this parameter given its crucial importance in the definition of channel grouping (unless you customize your channel grouping .)
2 – utm_source : customization of this parameter is possible but not recommended given the importance of the name of the site / network (Facebook, Google, Adwords) in the analysis of a campaign. Not to mention that this parameter is already formatted in a particular way in the default script of other source utms in your Google Analytics system. Ideally, as with all other sources of your analytics , it is best to limit yourself to the site your user was on before going to yours. An example: you want to compare the performance of your sponsored posts on Facebook with that of organic posts. If you keep an utm of type: utm_source=facebook , utm_medium=cpc and utm_campaign=mysupercampaign , you can then easily do this analysis by selecting filter the source in your report. If, on the other hand, the value of the utm_source is personalized ( facebook_campagneXcreatifY ), your analysis may be more complicated because the number of variations of your source parameter for your traffic identified by a utm may be significant.
3 – utm_campaign : it is strongly recommended to personalize it, it exists and was created for this purpose. Many combinations for the same campaign don't look pretty in your report by campaign because the results for one campaign are split across multiple rows. But on the other hand, thanks to a rigorous nomenclature, you can easily filter your results both in Google Analytics and in a visualization platform like Google Data Studio, Datorama or Microsoft Power BI, without any sampling .
In conclusion, it is important to insist on two points:
-
Another major advantage of concentrating as much information as possible in the utm campaign / source / medium trio is that as this data is located in the pre-aggregated reports, they will not be affected in the event of a management error on the retention of data. In other words, you won't lose any data if some of your account is erased by the implementation of the new data retention settings .
-
Adopting a clear nomenclature and limiting the sampling as much as possible in your campaign structures is one of the central pillars of effective reporting, especially since the sampling can sometimes not be seen directly, especially when the data is processed. in viewing platforms.
Good analysis!

-1.png)