![]() This is the 1st article in our series of 4 presenting the results of the survey on user behavior on Twitter . Although not scientifically supported, this survey is above all intended to be an indicative portrait of this community. We have already presented some of the results during the conference Understanding tweeters at the last Infopresse day.
This is the 1st article in our series of 4 presenting the results of the survey on user behavior on Twitter . Although not scientifically supported, this survey is above all intended to be an indicative portrait of this community. We have already presented some of the results during the conference Understanding tweeters at the last Infopresse day.
We are pleased with the participation rate and the buzz generated on Twitter. The community responded rigorously to the 22 questions asked.
The survey was carried out from May 27, 2010 to June 7, 2010, 1773 people started the survey: 278 respondents completed it and 230 partially completed it. It was distributed mainly on Twitter and relayed by users. It can be determined that the sample represents only part of the community targeting, among other things, only French-speaking Quebec.
We begin by revealing the typical profile of survey respondents according to three characteristics: socio-demographic profile , level of experience and frequency of use .
A. THE SOCIO-DEMOGRAPHIC PROFILE
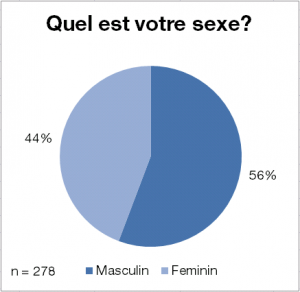
Respondents are distributed almost evenly between the two sexes giving a slight superiority to the male sex with 56% .
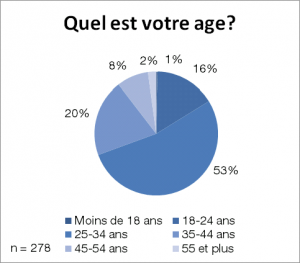
The majority of users (73%) are between 25 and 44 years old . We can consider that it reflects the age group of the professionals. We also note that the 45 and over are under-represented with approximately 10% of the proportions.
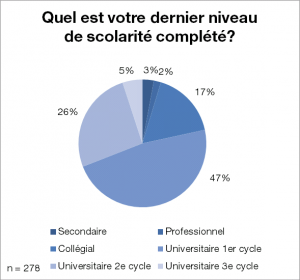
The level of education is relatively high, 78% of respondents hold at least an undergraduate university degree . The proportion of doctoral students (5%) is equivalent to the combined proportion of respondents who have reached secondary (3%) and professional (2%) level.
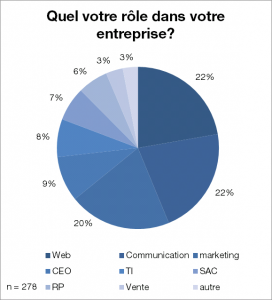
It is no surprise that the fields of web (22%), communications (22%) and marketing (22%) are the most represented by survey respondents. On the other hand, we note an under-representation of the field of public relations (6%). One would have thought a greater proportion equivalent to communications. One can believe that the sampling could have affected these proportions.
B. LEVEL OF EXPERIENCE ON TWITTER
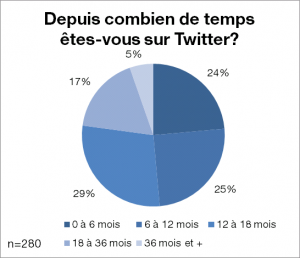
With Twitter's growing popularity and media heyday over a year ago, 49% of respondents have been a member for less than a year . Presumably the media and the addition of popular influencers has boosted massive membership over the past year. Veterans (over 36 months) make up only 5% of respondents. Also, an average user has been a Twitter member for just over a year (398 days).
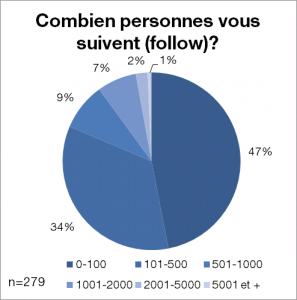
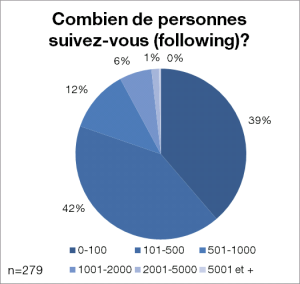
Interestingly, 81% of respondents follow less than 500 accounts and the same proportion of respondents are followed by less than 500 accounts . Which is definitely not much considering that more than 51% of respondents have been Twitter members for over a year. Also, we can say that a user follows an average of 374 accounts and is followed by 405 accounts giving a followers/following ratio of 1.08 . We can therefore say that 8% of accounts following a user are accounts without followers. One could think of spammers or new Twitter followers.
C. FREQUENCY OF USE
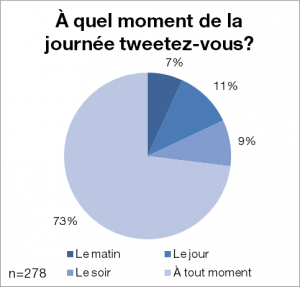
62% of people tweet at least once a day and even 29% tweet throughout the day . Respondents can be considered heavy users of Twitter. The lowest proportion of respondents (14%) tweet less than once a week.
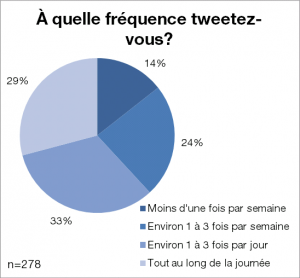
It is completely consistent with the last statement that 73% of respondents tweet at any time during the day . We can also say that tweeting is a rather ad hoc activity and is motivated by a spontaneous event.
Here are the first results of our survey. We'll follow with top respondent habits, tools used , and top Twitter moments.