When should I publish or reuse content? What messaging should I prioritize at what time for our product? And, what’s the most strategic time of year to promote our brand?
These questions come up time and time again when we are consulting on content projects. Over time and after spending endless hours thinking about how best to plan content around data, we’ve come up with a way to answer them.
So, without further ado, we’d like to introduce a tool you can use to plan seasonal content; a decision-making guide based on what users are searching for online. This tool allows brands to plan around a theme or even a product, taking into account the user queries that might align with your goals during a particular month (which is why we’re talking about seasonality).
Why adapt your content to the season?
In search, the user actively searches for information with a specific idea in mind. On social media, the user is passive and isn’t looking for anything in particular. They rely on their accounts and networks to provide content that will inform and entertain them.
These two approaches require two very different ways of planning and presenting information. Content published on social media needs to be perfectly aligned with the time, the season and the trends of the day to connect with users. Nothing new there. And yet still, the idea of strategically planning content for social media that’s based on the principles of user research isn’t obvious to everyone.
How does the season-based planning tool work?
The season-based content planning tool is a support tool to help with decision-making around content production. It can be launched in Excel or a Google Sheet.
The first thing the tool does, is provide an overview of the popularity of different themes for each month, as compared to the annual average.
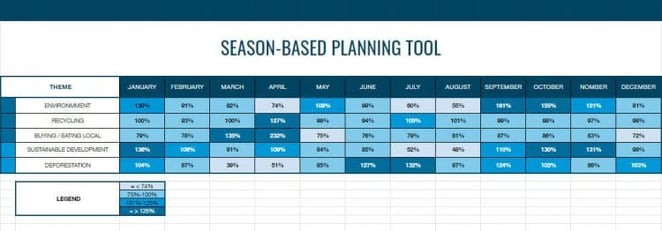
In this example, we selected 5 themes related to the environment. You can see at a glance that the month of April is when queries about recycling are at their highest, as compared to the rest of the year.
Secondly, this tool also allows you to analyze each theme in greater depth by comparing the levels of popularity of associated queries, always by month. The darker the colour, the more popular the keyword as compared to the annual average (which means it is “in season”).
In the example below, the percentages displayed represent the number of monthly queries, as compared to the average for all months of the year.
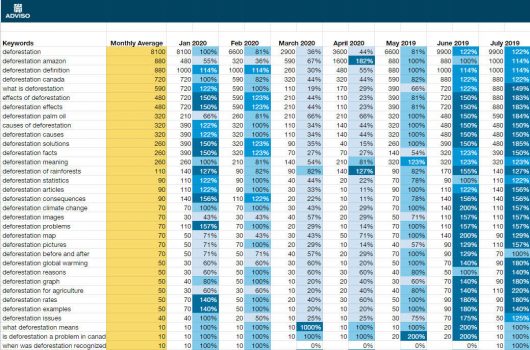
In this example, under the theme of recycling, it’s easy to see which queries are very popular in the month of April. The most popular queries and questions clearly relate to materials and recycling centres. We can therefore deduce that spring cleaning creates an influx of questions on how to recycle. We might then plan to create an infographic that visually explains how various materials can be recycled, to be published in the month of April.
How can you make your own planning tool?
1 – The first step is to ask yourself, as a brand, what themes are most appropriate to create content around. Does your organization aim to promote any particular subjects or products? Start by thinking about that, and take it from there.
Note that there is no limit to the number of themes you can use, but the more you have, the longer your research will take, and the denser your document will be. Moreover, not every theme will have a large number of queries associated. Similarly, certain topics will be very broad, and you will need to tidy up the keywords a little to make sure you’re focusing on the most relevant ones.
2 – Start your keyword research. Keywordtool.io, Ahrefs and Google’s Keyword Planner, among others, offer options for downloading keywords that include monthly search volume.
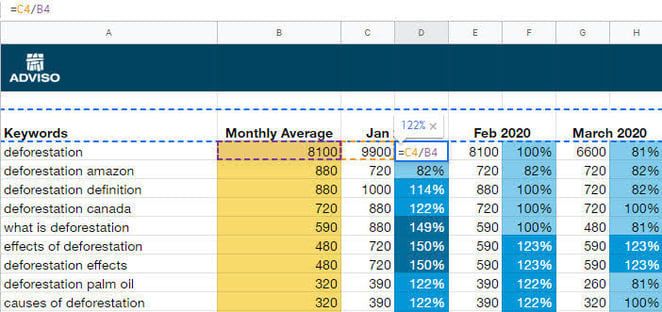
3 – Make sure you’ve thoroughly researched all your themes and associated queries. Once you’ve downloaded all your documents, the layout will include a column for the annual monthly average as well as columns for each month.
4 – Next, enter a simple formula in the columns to the right of each month to show how the monthly volume compares to the annual average, and you’re done! You may also want to add a colour code so you can visually identify content opportunities for each month.
Some queries have little volume (10 or less). We usually add them to the tool anyway, because they can help us identify secondary ideas or understand the full picture of what people are asking about a subject.
And there you have it, a very simple way to create a planning document based on user research!
Happy planning!