When to publish or reuse content? Which message to prioritize when for my product? Or, what time of year is the most strategic to promote my brand?
These questions come up very often when working in content consultation. Over time and out of a constant concern to plan data-based content, we have found a certain way to respond to it.
We therefore present to you the planning tool according to seasonality, a decision-making aid guide based on online user research. This tool allows a brand to plan around a theme or even a product and to know the user searches that align with it during a particular month (this is why we talk about seasonality).
WHY ADAPT ITS CONTENT ACCORDING TO SEASONALITY?
In SEO, the user actively searches for information with a specific idea in mind. On social media, the user is passive and not looking for anything in particular. Instead, he relies on his subscriptions and his network to provide him with content that can inform and entertain him. It's a very different way of planning and presenting information. Content published on social media must therefore fit perfectly in time, in season and in tune with the times to appeal to users. Nothing new here. However, strategically planning content on social media based on user research principles is not easy for everyone.
WHAT DOES THE SEASONALITY PLANNING TOOL CONTAIN?
The content planning tool based on subject seasonality is a decision-making support tool for content production. It can be used in an Excel sheet or a Google Sheet.
The first function of the tool is to provide a summary summary of the popularity of themes for each month, compared to the annual average.
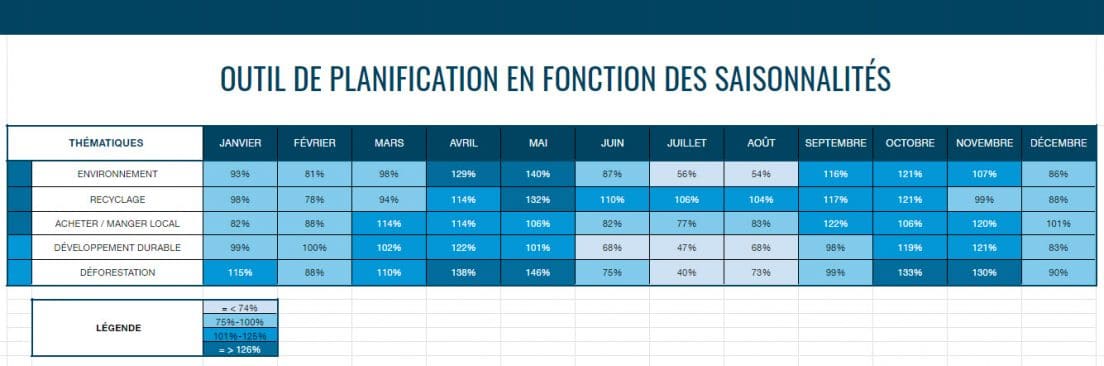
In this example, we have selected 5 themes related to the environment. We can thus quickly see, at a glance, that the month of May is the time when the requests for recycling are in greater number compared to the rest of the year.
Secondly, this tool also makes it possible to analyze each theme in more depth by comparing the levels of popularity of the associated queries, again according to the month. The darker the color, the more the keywords are searched for relative to their annual search average (meaning good seasonality).
In the example below, the percentages displayed represent the number of monthly queries compared to the average for all months of the year.
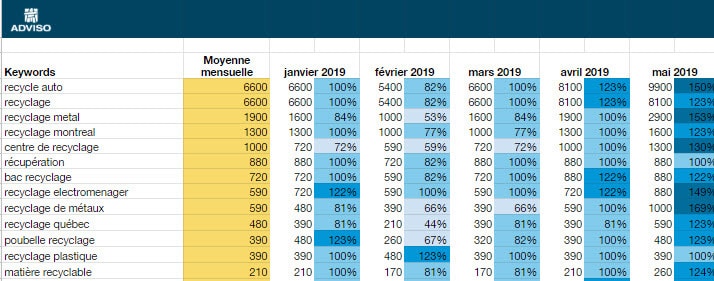
In this example, under the theme on recycling, we can see which requests are very popular in the month of May. We note that these are requests and questions about materials and places of recycling. We can deduce that spring cleaning creates an influx of questions about how to recycle. We could therefore plan the creation of an infographic explaining visually which materials are recycled in which way, to be published in May.
HOW TO MAKE YOUR OWN PLANNING TOOL?
1 – The first step is to ask yourself, as a brand, what are the themes on which it would be relevant to create content. Does your organization have a mission to promote a particular series of topics or products? Start with that and then decline.
Note that there is no limit to the number of themes, but the more there are, the longer the search time will be and the denser the document will be. Moreover, not all the themes will have large variations of associated queries. At the same time, some topics will be very broad and will require some cleaning among the keywords to remove the less relevant ones.
2 – Start your keyword research. Keywordtool.io , Ahrefs , and Google's Keyword Planner , among others, provide options for downloading keywords by including search volumes for each month.
3 – Make sure to do a good research of all related topics and queries. Once the documents are uploaded, the display will include a yearly monthly average column as well as columns for each month.
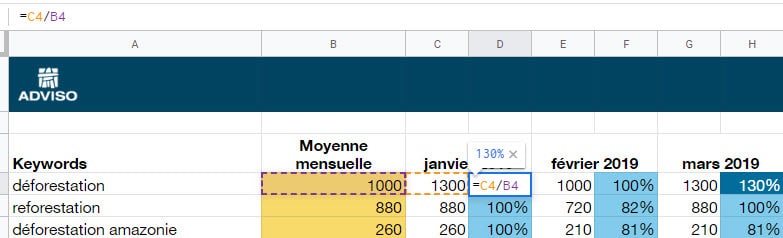
4 – Then enter a simple formula in the columns to the right of the months to reflect the proportion of monthly volumes compared to the annual average and voila! Adding a color ruler will visually identify content opportunities for each month.
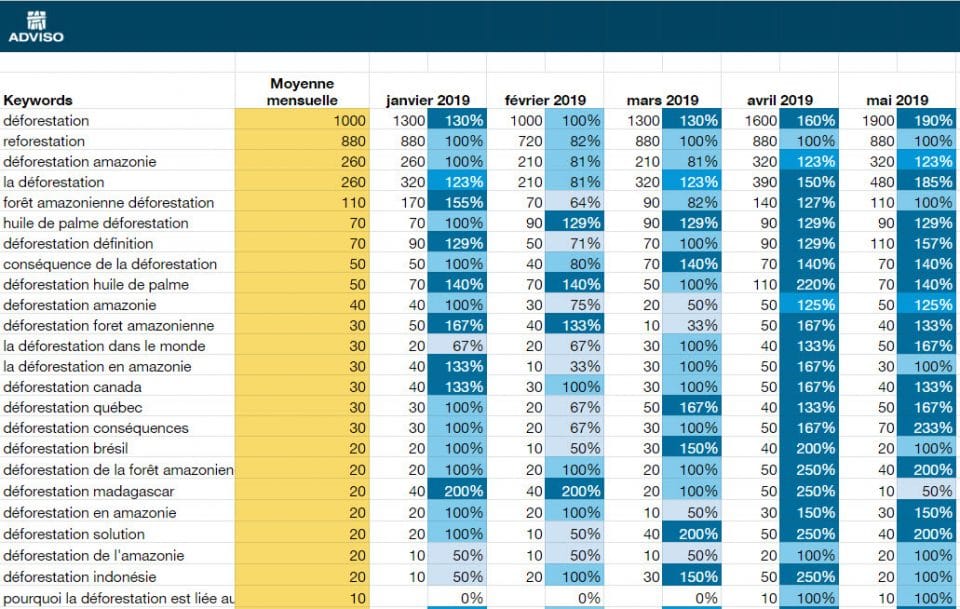
Some queries have few volumes (10 or less). They are generally added to the tool all the same, because they can help develop secondary ideas or understand all the questions around a subject.
There you have it, a very easy way to create a planning document based on user research!
Happy planning!