How to structure your analytics campaigns the best possible way in order to avoid data sampling in your results? Learn from our analytics expert in this article!
Change the pyramid
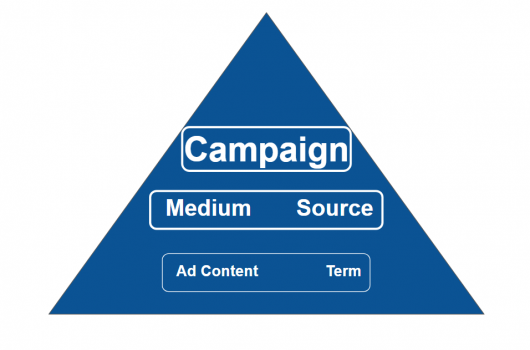
Using the structure of a pyramid is an excellent way to explain the ideas behind the UTM tagging of a campaign, as I did in my article on choosing the best structure for your UTM campaign hierarchies. Except there is ONE thing that problematizes this hierarchy: sampling, which sometimes becomes a problem when you use too many parameters, or use them badly.
Therefore, if you intend to completely respect the processing flow chart (the process that attributes a source to a session), rather than representing the structure like this:
It would be better to represent it like this:
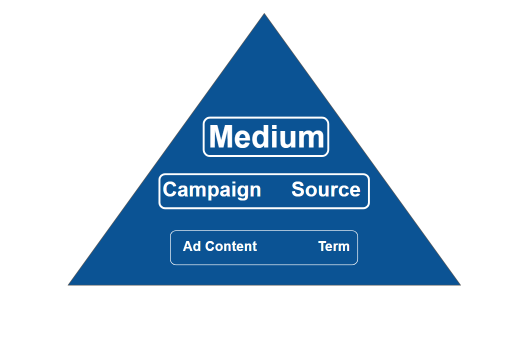
The intuitive architecture of Google Analytics campaigns works by grouping together results in an aesthetic way, where each campaign is associated with a line of the report. Unfortunately, this tagging strategy does not completely avoid sampling. This approach is suitable for the first phase of a small campaign, but will become a problem when the time comes to analyze a lot of data, such as yearly analyses. And let’s not even talk about big campaigns! The solution to this problem is to adopt a tagging strategy based on the use of the UTM parameter Campaign. This will allow you to avoid sampling, which would ruin your analysis.
Reminder: Sampling and standard reports
Sampling applies only when user requests go beyond 500,000 sessions at the property level you are analyzing AND the analysis is not done using a default Google Analytics report.
During the last step of processing your data, Google Analytics creates a default report, also known as a standard report. These reports have one huge advantage, namely that they are never subject to sampling. Like most of the reports produced by Google Analytics, campaign reports are standard reports, even if a secondary dimension is added. Another interesting point you should know is that you can filter the data as much as you like in the fields Campaign and Source/Medium and no sampling will be applied to the report. Very practical for analysis!
On the other hand, if you pivot the reports by adding a secondary dimension that is not part of the default dimensions, these reports will no longer be considered standard. For instance, if you take the same campaign report but add the secondary dimension Ad Content from the parameter utm_content… Wham! You end up with mega-sampling and a potentially unusable report.
As an illustration, here is the same campaign report combining two different secondary dimensions: on the right Source/Medium and on the left Ad Content.
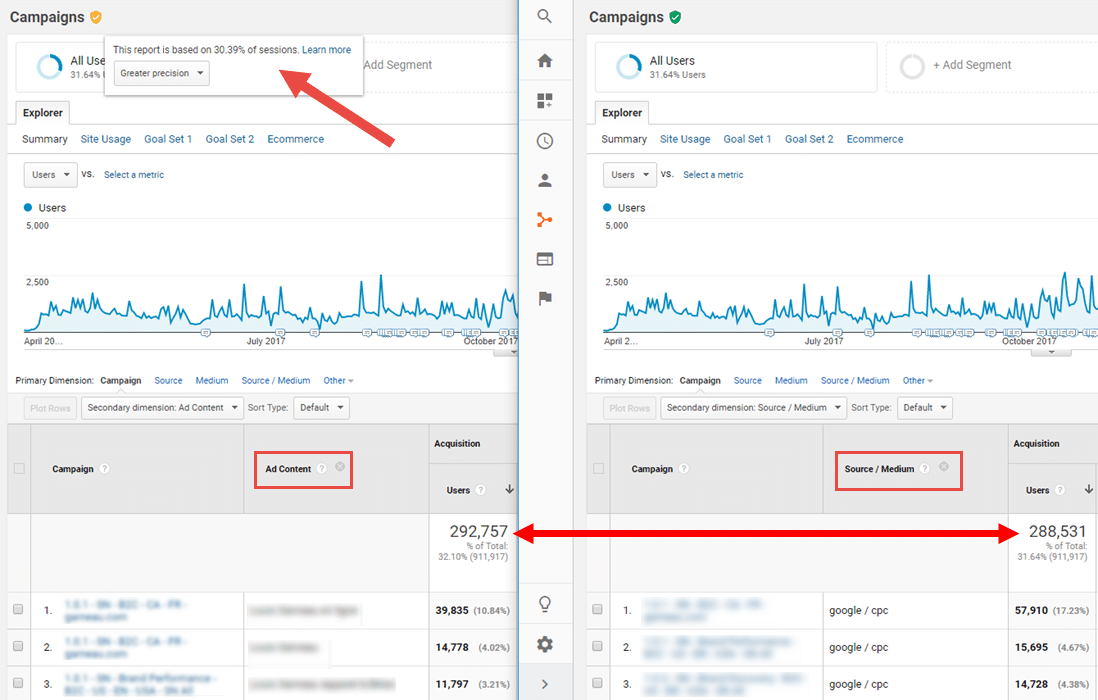
Note that in the report with Ad Content, according to the message beside the orange badge the report has been sampled from 30.39% of the sessions. The report with Source/Medium has not been sampled, since the badge is still green.
So it seems that sampling results in a change in the number of users: The actual number is 288,531 in the report on the right, while this number has been overestimated, at 292,757, in the report on the left. Although this doesn’t seem like a big difference initially (a question of a difference of 4,226 users), sampling is damaging for many reasons:
- The sampling process is not consistent: It can vary depending on whether you generate your analysis in the morning, the evening or the next day. This means the analysis is not reliable since the same request will produce different results depending on when the analysis is made.
- While the difference may have a fairly insignificant effect on the totals, it could have a much bigger effect in smaller collections of data, such as for small campaigns and sub-campaigns.
- The different indicators will not vary to the same degree: sampling might lower your sessions by 15% but increase your revenue by 30%.
If you have the opportunity to access a Google Analytics Premium account, you can download a non-sampled report. But if you’re part of the majority of Google Analytics users, your only option is to reduce or divide up your date ranges in order to lower the sampling rate to a more reasonable percentage. This results in wasted time and more manual interventions, not to mention the metrics you can’t add, like users, which will complicate the analysis.
How to avoid sampling
The answer is to use the full potential of the three mandatory parameters included in every session logged by Google Analytics. And note that I did say all sessions, because even sessions that are not part of a campaign have the utm_campaign parameter, it’s just that the value attributed to it is (not set).
Here is an overview of the three parameters:
1 – utm_medium: Personalizing this parameter is not recommended given its major role in the definition of Channel Grouping (unless you intend to personalize Channel Grouping).
2 – utm_source: While personalizing this parameter is possible, it is not recommended given the importance of the name of the site/network (Facebook, Google, AdWords) in campaign analysis, not to mention that this parameter has already been formatted in a particular way given the other utm_source parameters in your Google Analytics system. Ideally, as with all other sources of your analytics, it is preferable to restrict your analysis to the site your user was on before navigating to your own site. For example: Say that you want to compare the performance of your sponsored ads on Facebook with organic ads. If you use a UTM like utm_source=facebook, utm_medium=cpc and utm_campaign=myamazingcampaign, you will easily be able to do the analysis by selecting Filter Source in your report. However, if you personalize the value of utm_source (facebook_campaignXcreativeY), your analysis will become more difficult because the number of variations of your source parameter for the traffic identified by a UTM might be quite large.
3 – utm_campaign: This is definitely a parameter that should be personalized— in fact, it was created for that purpose. While numerous data ranges for the same campaign might not look pretty in your campaign report because the results will be spread over many lines, using a rigorous naming protocol will let you easily filter the results in Google Analytics, or even in a visualization platform like Google Data Studio, Datorama or Microsoft Power BI. Plus, you get all this with no sampling!
To sum up, the following two points should be emphasized:
- Another major advantage in concentrating a maximum of information in the utm_campaign/source/medium trio: Since these data are found in standard reports, they will not be affected if there is an error in data retention management. In other words, you won’t lose any data if parts of your account are erased when you set up new data retention parameters.
- Adopting a clear naming principle and limiting sampling in your campaign architecture as far as possible is one of the main pillars of efficient reporting, especially considering that sampling is sometimes not immediately obvious, particularly when the data are presented using visualization platforms.
Happy data analysis!

-1.png)