The reports offered in the Google Analytics interface satisfy the vast majority of its users. And for good reason, they answer most of the questions you may have about the performance of content, campaigns and user behavior. Google Analytics also allows the creation of dashboards to have an even more refined and personalized view of its data.
But maybe you have other needs that aren't met by the classic interface. If so, rest assured, because Google makes most of the interface data available to you through a simple and powerful API. The same query engine is used for the same efficiency .
What are the reasons or benefits of using the Google Analytics Data Export API? Here are some examples. The screenshots are taken from an application that we have developed.
YOUR OWN VISUALIZATIONS
If you are passionate about data visualization or if you simply believe like me that a good visualization allows to improve the understanding of complex phenomena, the extraction of data by the API will allow you to achieve your goals. Once the raw data has been extracted, all that remains is to combine it, grind it and present it as you wish.
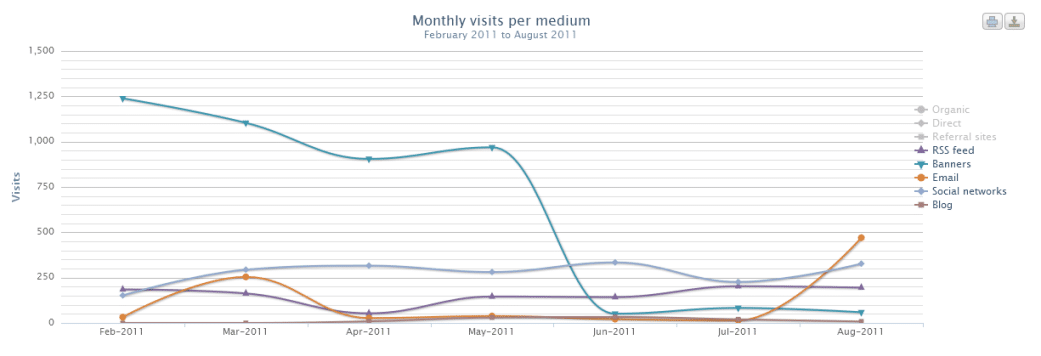
The simplest example is showing your website traffic for all traffic mediums. Google Analytics allows this visualization, but for a limited number of media. With the extraction of your data, this constraint no longer exists!
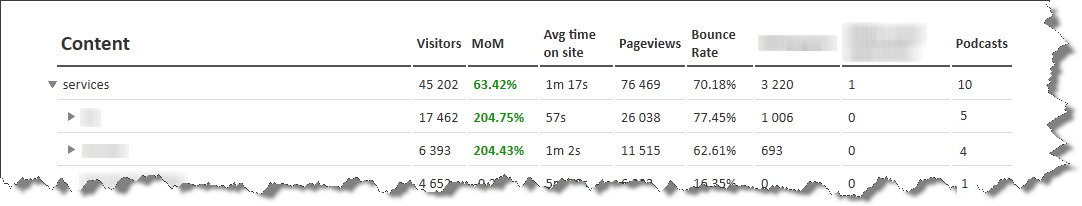
How about viewing your website according to its unique tree structure? It is certainly an extremely revealing and unachievable display from the classic interface.
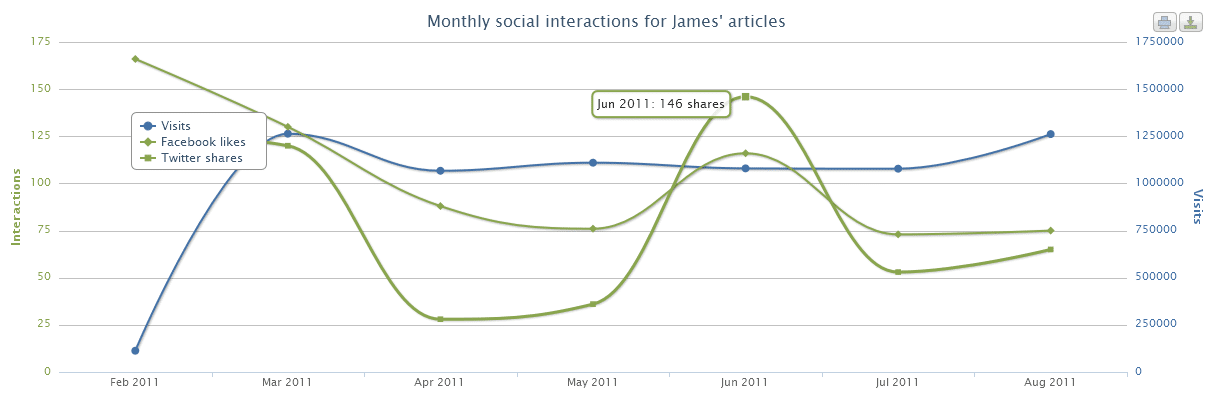
Visualize social interactions on content of interest.
If you want to push the exercise a little further, you have the freedom to create your own dashboards and your own reports. Centralize it (a web application perhaps), use a vocabulary unique to your company and the members of your organization will suddenly see this data in a whole new light.
More examples here of visualizations and the use of the Google Chart API.
INPUT FROM OTHER DATA SOURCES
Google Analytics is a wonderful tool for analyzing your web data, but its mandate ends there. If you want to cross-reference your web data with other data sources from the finance or marketing department, using the API is convenient. An example is the calculation of the ROI of your online campaigns including management fees, offline advertising or call-tracking.
Another application of the API is the integration of numerical targets to visualize the performance of your website in relation to the objectives you have set for yourself. Finally, reports that take your business reality into account!
OTHER APPS
Whatever it is, the strength of a report comes down to three things: its target audience, its content and when it is sent. The solution offered by Google Analytics is the automatic sending of reports by email, but this function has its limits.
With Google Analytics, all users have the same view of the data, whether it's executive, marketing, IT or finance. The API makes it possible to remove this constraint by ensuring the management of users and precisely targeting its recipients. The content is chosen according to their business needs and the mailing can be personalized.
For the more daring, the statistical analysis of data is an attractive avenue. It makes it possible to apply powerful analysis tools to the data and to obtain useful and even sometimes surprising information. Web data being what it is (anonymous and imperfect), however, you have to know what you are doing. Here are some applications of statistical analysis:
- What items are often purchased together in the same transaction?
- What types of visitors look alike and how?
- Given the characteristics of a group, what is the probability that it performs this type of action?
Software like R and SPSS (one free, the other paying) are quite suitable for this kind of task.
In conclusion, the Google Analytics API allows you to focus on the questions that really matter to your organization by allowing you to forge your own performance indicators. It opens the way to better decisions, more seized opportunities and a better understanding of the use of your websites. If used well, it allows you to better target your optimization activities and to drop reports with little actionable information.
It's your data after all, free it!


%20(1).jpg)