Today I am completing the second and last part of the content site or blog part of my series on the 5 main performance indicators by Internet business model.
3- THE FREQUENCY OF VISITS
Frequency is a loyalty indicator that calculates the number of visits made by a unique visitor over a given period. The frequency of visits depends a lot on the frequency of updates of your content as well as the volume of content produced. The target to be reached should be essentially based on the number of articles produced over a given period.
If, for example, you produce 4 articles in 1 week, your target to reach will be a frequency of visits of 4. You could also give yourself an average hit rate for a period (frequency / number of articles published).
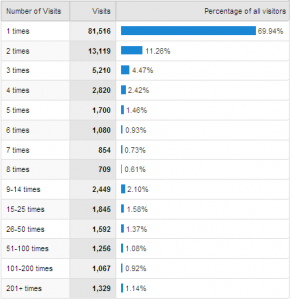
In addition, you will need to segment this indicator by your main traffic sources in order to better target where the shortfalls are. Your expectations must be high towards the sources referring sites, more precisely the RSS feed aggregators as well as the email source because they are the ones who encourage your readers to visit new content.
Here is how to access this data with Google Analytics : Visitors > Visitor Loyalty > Loyalty.
4- AVERAGE REVIEW RATE OF AN ARTICLE
The review rate of an article or content page indicates its relevance. This indicator should be interpreted with great caution. The home page and section home pages will always have a higher replay rate than the final content pages because they are navigation cues for users. You should therefore not consider them in your comparison. The way to calculate it is to divide the number of page views by the number of unique views. Obviously, you will reach a minimum rate of 1. The goal is to maximize this rate.
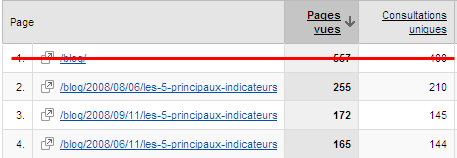
To do this, you can compare all new content to your barometer or featured content. You can compare them by article or by theme. Your goal is to identify the elements that have maximized their proofreading rate (subject, author, text length, photos, videos).
Here is how to access this data with Google Analytics: Content > Most viewed pages
5 – READING RATE OF SUBSCRIBERS TO YOUR RSS FEEDS
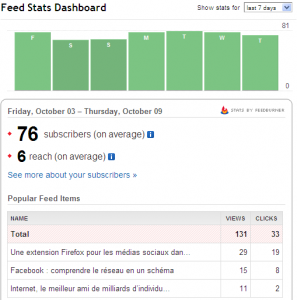
This indicator is mainly applicable to blogs, but can be used for content sites. We often see on blogs the number of subscribers to their RSS feed. Bloggers often make it their main focus. But what about the interest of its subscribers in the face of your content? You can already know the number of unique visitors coming from aggregators in Google Analytics. A number that can be divided by the number of subscribers to your RSS feed. This rate will be considered as the attraction ( reach ) of a post. The closer the rate is to 1, the stronger the attraction.
Also, if you measure the performance of your RSS feeds with Feedburner (powerful, simple and free tool), you can know the number of views and clicks in the aggregators. We are talking here about the attraction of an article. This data is relevant in two situations:
1) When all of a post is available in the aggregator, it completes its number of real views.
2) When part of a post is available in the aggregator, it measures the ability to encourage the reader to read the rest of the content. In this situation, the ratio number of clicks on the number of views becomes interesting.
This is where my series of articles on key performance indicators by site model ends. The objective was to present indicators often forgotten or underestimated by analysts. Do not hesitate to comment on the different posts by giving me your favorite indicators.

Why the performance indicators you use will become unreliable
The challenge of the moment, with the apocalypse of cookies , is to fully understand the repercussions of such a transformation in the digital world. Today, we are going to take a closer look at its consequences on the measurement of data, what we call analytics . Get ready, you will have to question several performance indicators that you observe on a daily basis to measure your effectiveness! We will therefore focus mainly on the repercussions of the cookie apocalypse on primary cookies. Unlike third-party cookies, which tend to disappear, primary cookies will remain relevant, but will experience major changes: the lifetime of primary cookies will be limited to 7 days (or even 24 hours in some cases) on the Safari browser; Cookies on Firefox will be deleted daily unless there has been user activity within 45 days. CHANGES IN YOUR DAILY LIFE What does this limited lifespan imply? In fact, this means that it will be difficult to recognize a user from one visit to another, which will ha …

The 5 main performance indicators for an e-commerce site (2 of 2)
Today I am completing the second and last part of the performance indicators part of my series. I invite you to read the first part of the performance analysis of an e-commerce site before attacking this article.
-Apr-02-2026-08-03-33-3374-PM.jpg)
The 5 main performance indicators for a site intended for lead generation (1 of 2)
We are often asked THE question by our clients/partners/colleagues/bosses: What are the main performance indicators to check in the management of my website? However, their selection is greatly influenced by the vocation of the website, because each has a unique strategy and objectives of its own. In order to answer this fundamental question as humbly as possible, I will publish a series of posts that will identify the 5 main performance indicators for 3 types of business model on the Internet.