What value do your Facebook posts have for your conversions?
This article is a collaboration of Yannick Proulx and Loic Karinda.
This is part two of our Facebook Analytics series . Check out the first part: Facebook Analytics and its omnichannel solution: Where to start?
BEYOND BASIC REPORTS
If you manage at least one Facebook page (for which you have administrator access) and one Facebook pixel installed on your site, you should have access to basic reports in your Facebook Analytics account. Be sure to take some time to review these reports and play around with a few segments.
Now, the killer question: do interactions like "likes", shares or comments on your Facebook posts have an impact on your conversions (or on other elements such as event pixels? )? We'll use a conversion funnel to find out. Exciting, isn't it?
GATHER YOUR DATA, THEN EXPERIMENT!
To get started, you'll first need to create an event source group , since your Facebook page and pixel data will be in two different analytics entities. The event source group is Facebook's way of linking interactions on your Facebook page to those on your website (which are tracked with the Facebook pixel) made by the same users. Simply put, this tool offers you an analysis that includes two channels and multiple devices . Wonderful!
Let's keep experimenting. To build a funnel, go to the “Activity” section and click on “Funnel”. The example below is from a Facebook page and a medical client website.
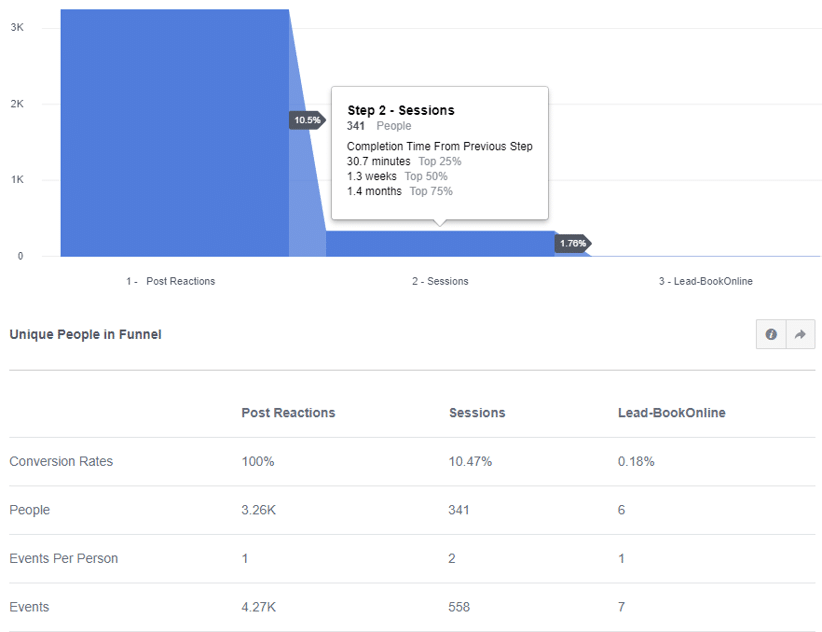
LET'S DISSECT
- The first stage of the funnel shows the number of reactions from the Facebook page.
- The second step tracks how many users visited the site after reacting to a Facebook post.
- The third and final step displays the number of converted users.
The period selected here covers the last 30 days. Note that the funnel sequence is not immediately after the Facebook action; below you can see a " Completion Time From Previous Step ". In step two below, 75% of people who reacted to the Facebook post went on to visit the website, but it took them up to 1.4 months to do so. Of course, you can take this funnel a step further by segmenting specific Facebook posts, different device types, cities, ages, gender, and more.
FIND ANSWERS
If you've ever wondered how much of a positive impact your Facebook posts have on your actual KPIs , now you know that building a funnel can answer those questions.
Did you like this second part of our Facebook Analytics series? Stay tuned! The third and final part of this series will tell you about the number of users interacting with your business by channel.
Have a question or comment about this article? Let us know!
Share this
You May Also Like
These Related Stories

What’s the value of your Facebook posts for your conversions?
This article has been co-written by Yannick Proulx and Loic Karinda. This is part two of our Facebook Analytics series. Read the first part: Getting started with Facebook Analytics & its omni-channel solution Beyond basic reports Once you have a Facebook Page (of which you are an admin) and a Facebook Pixel installed, you should see some basic reports in your Facebook Analytics account. Make sure you take some time to look at these reports and play with a couple of segments. Now, what we want to do is to build a funnel that will show us whether interactions like Likes, Shares or Comments from a Facebook Page Post can have an impact on website conversions or other key website activities (tracked with Pixel Events). Exciting right? Gather your data and build a funnel To achieve this, you’ll first need to create an event source group because the data from your Facebook Page and Pixel will be in two different analytics entities. An event source group is how Facebook unifies the analyti …

Facebook Analytics and its omnichannel solution: Where to start?
This article is a collaboration of Yannick Proulx and Loic Karinda. This is the first part of our Facebook Analytics series. Here is the following: Part 2 : What value do your Facebook posts have for your conversions? Not so long ago, Google Analytics was the go-to tool for knowing how users behave on your website. But today, with the amount of devices used, Google Analytics is no longer enough. And that's where Facebook Analytics comes in. Just like Google Analytics, Facebook Analytics provides basic information about your users: where they came from, which pages they viewed and for how long, from which devices, etc. You can even read Google's campaign information tags from the url (UTM parameters) in Facebook Analytics. Facebook Analytics may not have some more advanced features, like improved e-commerce, but they will be soon. What sets this platform apart is its ability to tell you not only what your users are doing on your website, but also on your Facebook page, your mobile app, …

On which devices do your users convert?
Your online users probably jump from one device to another when they interact with your business. Learn how to track these users with Facebook Analytics. This article has been co-written by Yannick Proulx and Loic Karinda. This is part two of our Facebook Analytics series. Read the first parts: 1 – Getting started with Facebook Analytics & its omni-channel solution 2 – What’s the value of your Facebook posts for your conversions? Where to start One of the main advantages of Facebook Analytics is the fact that most Facebook users are always logged into Facebook on all their devices. This offers Facebook Analytics precise cross-device capabilities other analytics platforms lack. Let’s say you are an e-commerce manager and you wonder how many users browse products, add a product to the cart and make a purchase across multiple devices? You can go to the Activity, then Overlap report for the answer. Let’s do that. On which devices are your products first viewed? The first screenshot bel …
Repérer et valoriser ce qui compte vraiment.
Recevez nos analyses et conseils pour rester à l’avant-garde du numérique.