Note: This analysis was done in French, using French themes and keywords. The images associated with this article are therefore available in French only.
Campaign variables, also known as UTM parameters, are one of the most widespread ways of measuring a campaign’s success. The principle is simple: by adding a few parameters to a URL, you can then precisely measure the performance of different elements of your campaigns by isolating them in Google Analytics or another reporting system. However, their apparent simplicity doesn’t mean you shouldn’t respect a few basic rules.
Methodology review:
A session starts when an interaction is sent to Google Analytics. This is generally a pageview, sent when the first page of the site visited loads. Because computers are generally very polite, they announce where they’ve come from (via the referrer in the http protocol, among others) and that’s how Google Analytics can show the dimensions related to the sources.
A session always has three required parameters:
It can also have two additional parameters:
All these values can be found in your analytics interface in different dimensions:
How to build them:
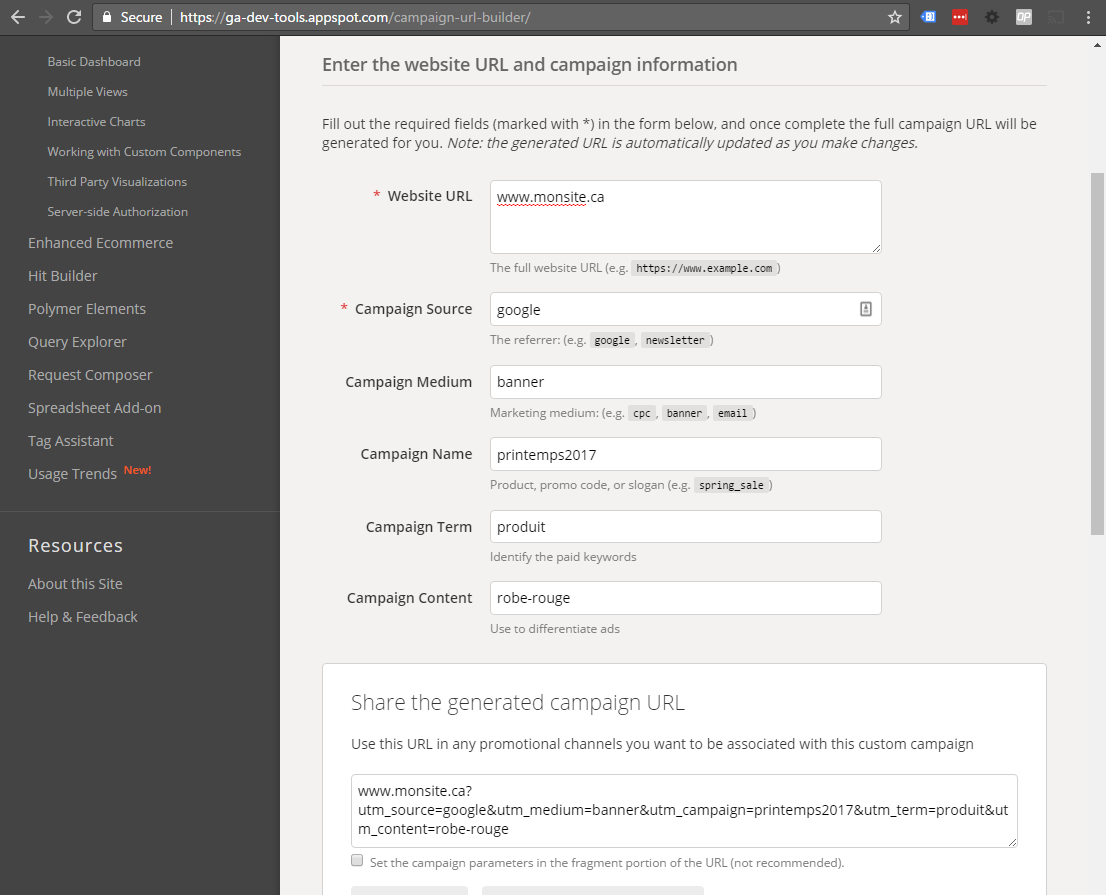
The idea of a UTM is to insert campaign parameters into the variables of your URL. So, www.retailer.com might be tagged like this:
You can use URL Builder, Google’s official tool, to build them:
You can also make them in a spreadsheet like Excel or Google Sheets. If you build them without using URL Builder, here are a few things to watch out for:
Be careful how you organize your tags! Poorly organized variables can quickly send you into reporting hell, and take valuable time away from analysis, leaving you with fewer insights. It’s therefore important to stick to a clear, specific structure. Here are a few tips to help you structure your variables and maximize their potential.
1. Before starting over, try to analyze what was already done
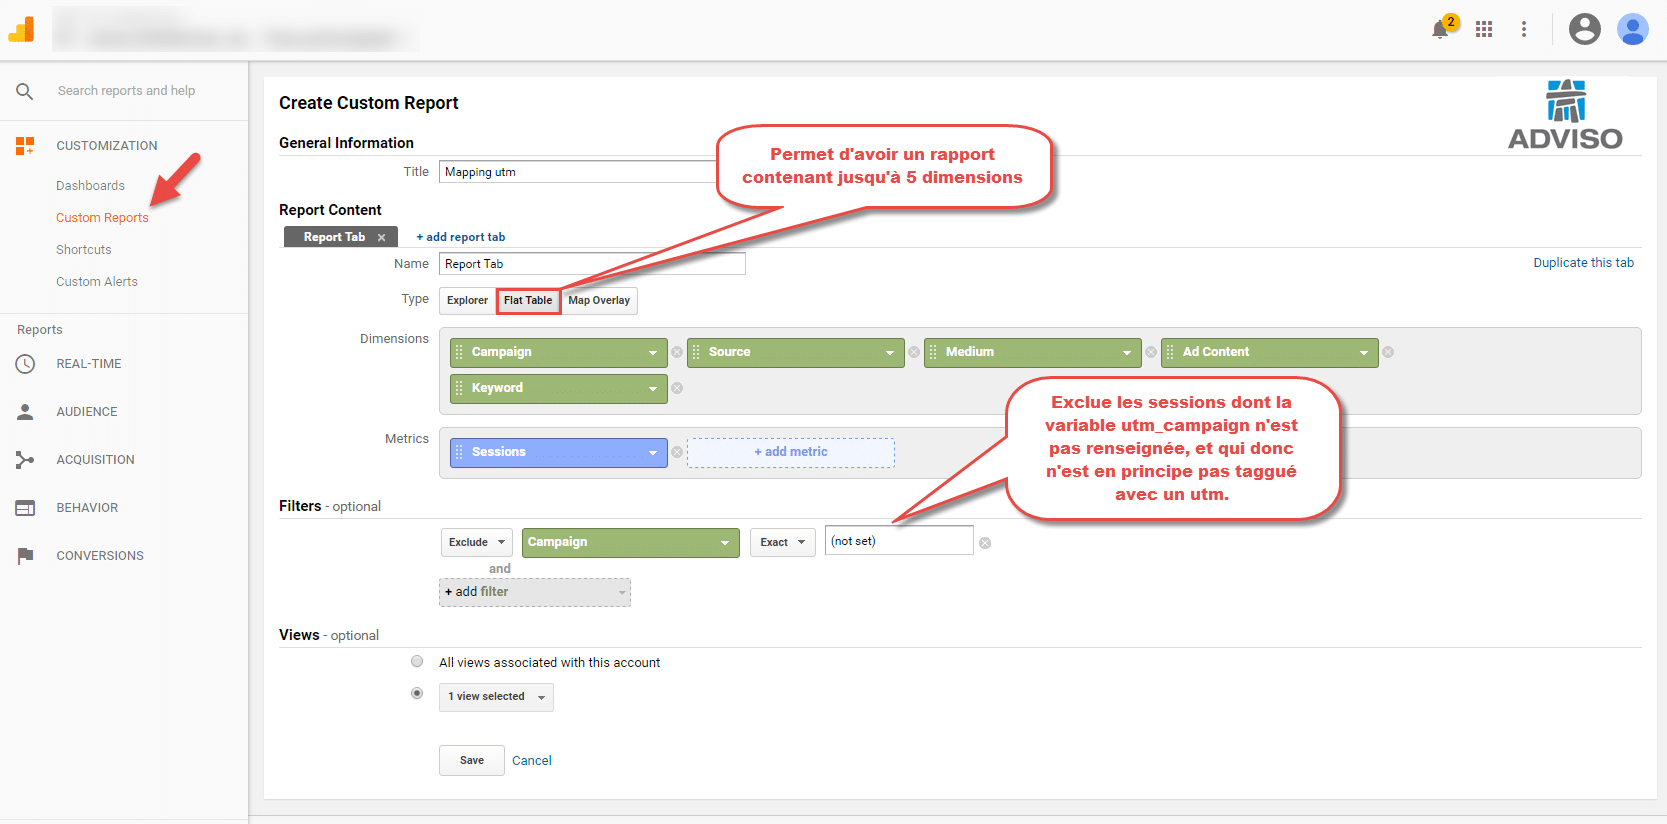
With help from this customized report, you can extract a complete map of your past campaigns from Google Analytics. This report extracts the above-mentioned variables, which allows you to get a clear map of what was done.
A few points to note while you’re building this report:
The result is a table you can export to Excel or Google Sheets, that you can then use to understand what was done in the past.
A few things to think about:
Depending on the results you get, you can then decide on how you will organize your campaigns in the future.
2. Organize it
Once you’ve got a clear overview of the situation, it’s time to take a step back. By analyzing and grouping together your parameters without worrying about their current structure, organize your initiatives into coherent, relevant groupings.
The idea here is to organize them with two goals in mind:
For example, an online seller regularly uses one-time campaigns as well as ongoing campaigns.
These campaigns use different tactics:
In order to execute these tactics, you develop different creative around various themes:
Including multiple versions:
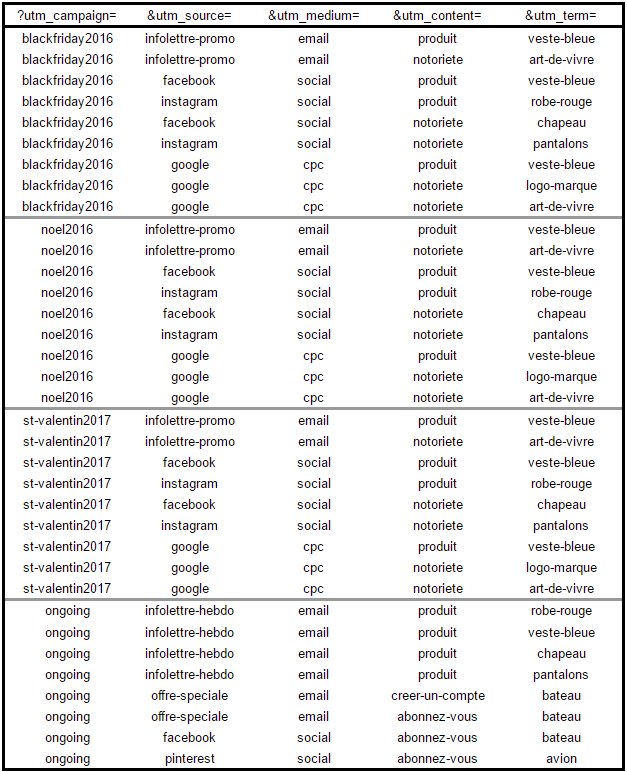
By structuring each of these parameters into specific UTMs, you end up with a tagging nomenclature that looks like this:
Your mapping should look like this in Google Sheets:
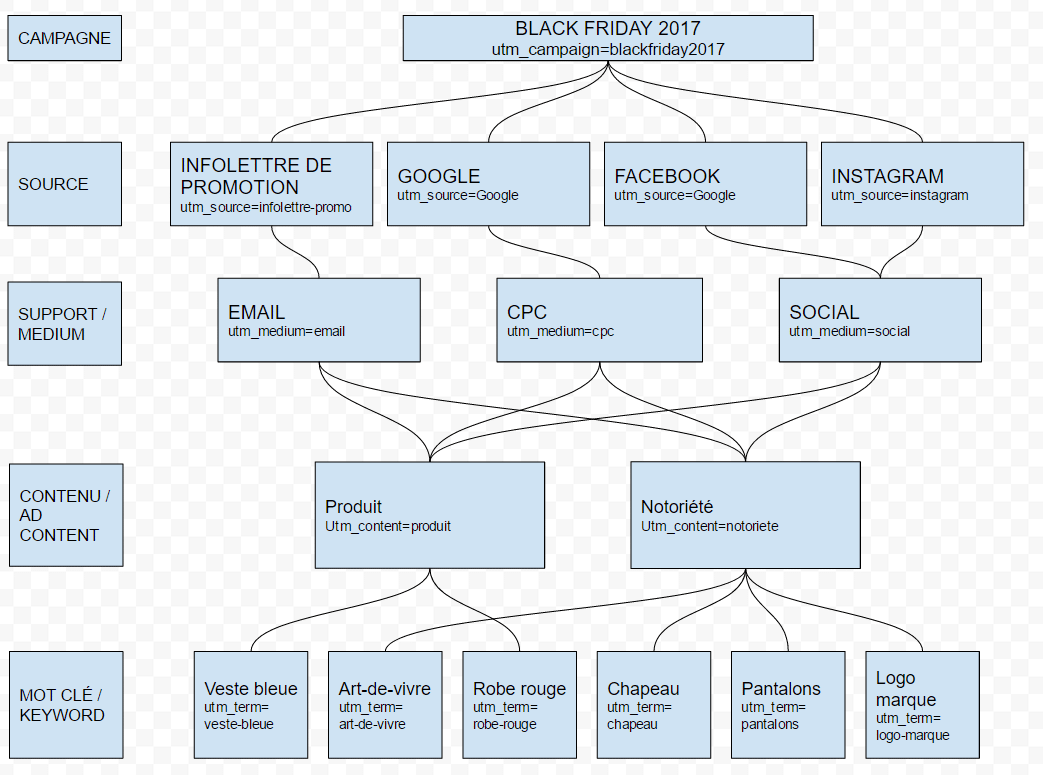
And like this in Google Analytics:
With this nomenclature, each element is easy to find and analyze. Note that all 42 sessions are findable, regardless of dimension. Verifying that this number is the same for each dimension will allow you to ensure that you’re always looking at the same data, just through a different lens for each dimension.
Though standard templates exist, the moment when you first develop your nomenclature is a very good opportunity to customize this nomenclature to your business context. That way the insights you gain from tagging your campaign variables will be even more relevant.
The next step is to adopt a tagging nomenclature, to standardize the way you tag all your initiatives.
3. Share your nomenclature internally and make sure it’s adopted
This is the least technical of the four points, but depending on your organization, it could be the trickiest. Sharing your nomenclature document will allow you to get buy-in from all the players in your ecosystem.
Aside from the fact that adopting this standard reduces the risk of error, the biggest advantage of this method lies in data analysis. When someone wants to see campaign results, they will have a complete manual explaining exactly what they are looking at: what type of information goes in each variable, and in what context.
So, instead of wasting valuable time trying to understand the data, they’ll be able to jump right into analysis, and draw valuable insights from your reporting system.
4. Go farther
Sometimes, five campaign parameters aren’t enough. In that case, there are a few options available. If you don’t need to add too many new information types, you can combine several parameters into a single variable, for example by separating them with an underscore “_”. Otherwise, it’s also possible to reduce your tracking to a single variable by using the utm_id campaign variable, which will give you a unique key you can use to link this variable to any number of other parameters issued from other databases, like your CMS, for example. You can then import them into Google Analytics, or export them elsewhere depending on your reporting and analytics needs.